ThreatStream Overview Dashboard
When accessing the Default dashboard page for the first time, you land on the ThreatStream Overview dashboard, which is one of the dashboards available to all Anomali platform users out of the box. The ThreatStream Overview dashboard is your default primary dashboard.
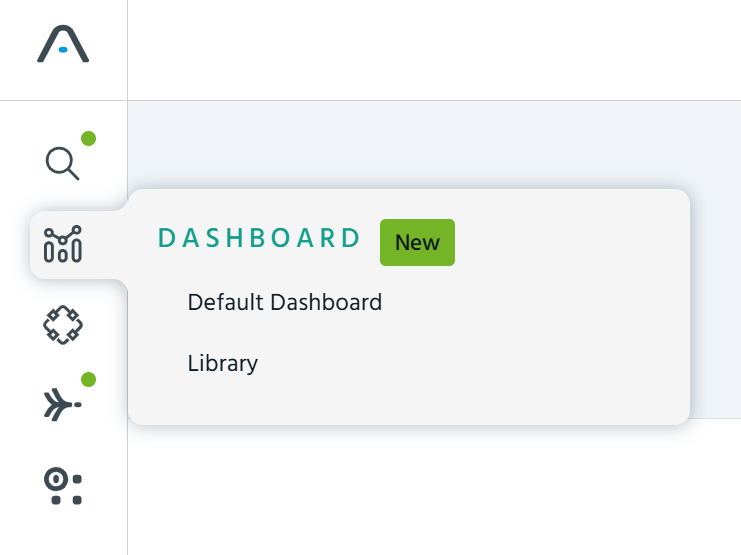
If you designate some other dashboard as your primary, the ThreatStream Overview dashboard can be found in the Library (Dashboard > Library)
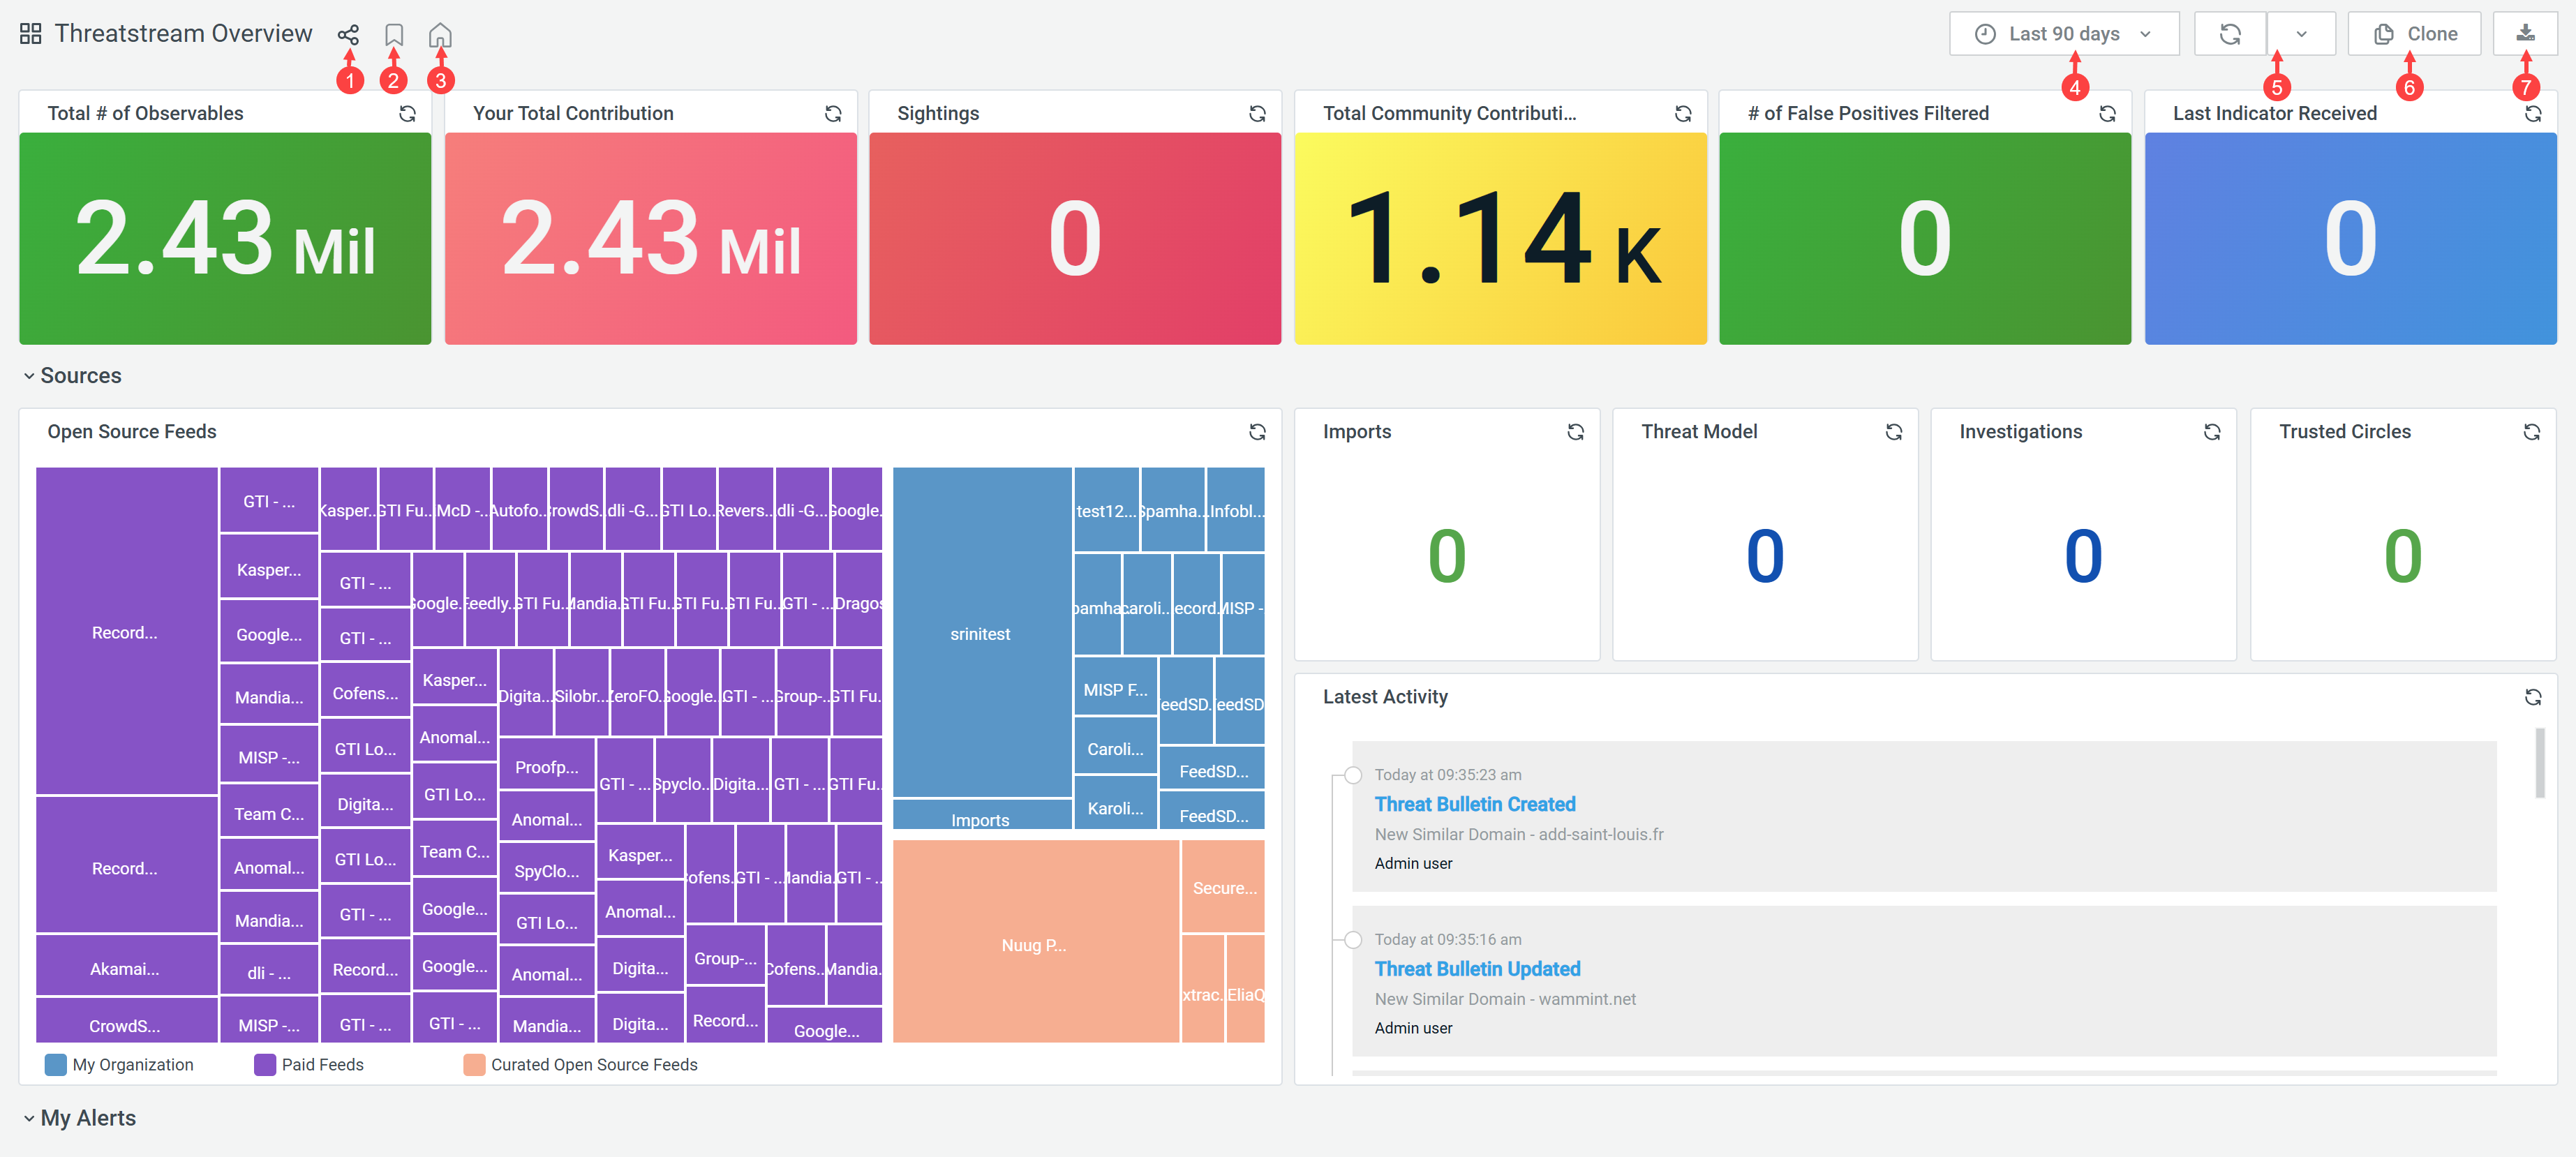
The ThreatStream Overview dashboard is the hub of proactive threat detection for your organization on ThreatStream. The dashboard includes panels that provide an overview of the intelligence available to you in ThreatStream. It also displays any alerts that require an immediate action. Furthermore, the ThreatStream Overview dashboard enables you to drill down on intelligence for deeper analysis.
Below is an example of the ThreatStream Overview dashboard.

|
Share the dashboard by copying the dashboard URL or exporting it in JSON format. For details, see Sharing Dashboards or Sharing Dashboards (Classic UI) if you use the classic UI. |

|
Add the dashboard to the list of favorites. All your favorite dashboards can be found in the Bookmarked section of the Dashboard menu. |

|
Designate the current dashboard as your primary dashboard. The setting is saved per user, so each user in the organization can designate their own primary dashboard. The name of the primary dashboard appears as the first item in the Dashboard menu. |

|
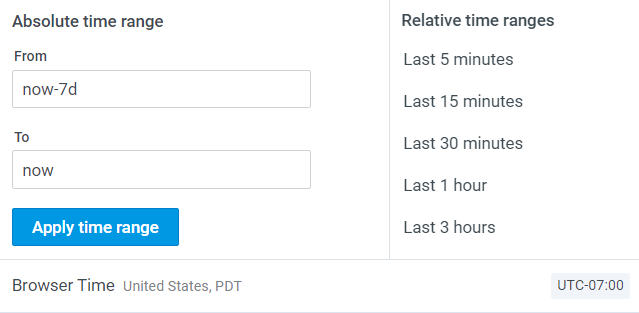
Select a time range for the data displayed on the dashboard. You can select an absolute time range or a relative time range. By default, data for the last 7 days is displayed.
|

|
Select a time range for refreshing the dashboard. Select Off if you don’t want to refresh the dashboard. Click |

|
Clone the dashboard. For details, see Cloning Dashboards or Cloning Dashboards (Classic UI) if you use the classic UI. |

|
Export the dashboard in PDF format. For details, see Exporting Dashboards in PDF Format or Exporting Dashboards in PDF Format if you use the classic UI. |
 to force dashboard refresh.
 ThreatStream Overview Dashboard Panels
The following table contains the list of all panels available on the ThreatStream Overview dashboard.
| Panel | Description |
|---|---|
| Total # of Observables |
Number of observables added during the time range selected for the dashboard. |
| Your Total Contribution |
|
| Sightings | Number of observables from the selected time range that triggered alerts in your integrated destinations. |
| Total Community Contribution |
|
| # of False Positives Filtered | Number of observables to which you have access that were reported as false positive. |
| Last Indicator Received |
|
| Sources |
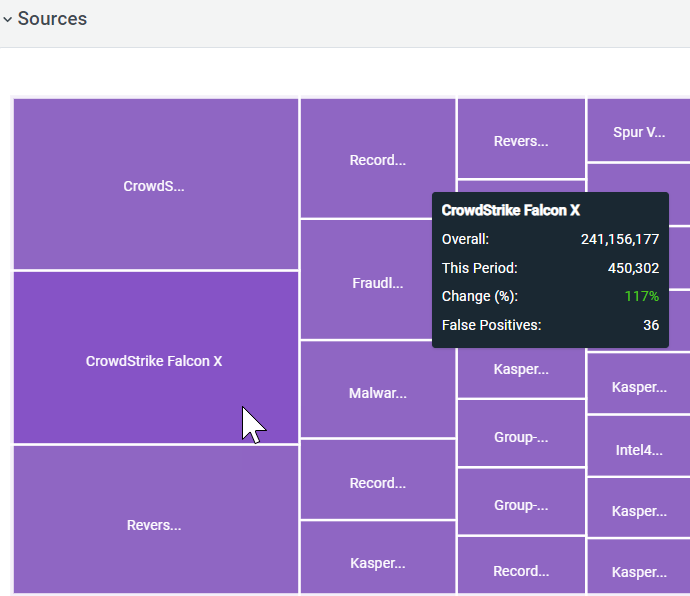
View statistics on observables added to ThreatStream via your organization, private feeds, and curated open source feeds. Hover over a source to view the source statistics over the specified period of time.
|
| Imports |
Total number of import jobs created over the specified period of time. |
| Threat Model | Total number of threat model entities created over the specified period of time. |
| Investigations | Total number of investigations started over the specified period of time. |
| Trusted Circles | Total number of trusted circles created over the specified period of time. |
| Latest Activity |
View the 10 most recent notifications on ThreatStream activity. Notifications are displayed when:
|
| My Alerts |
View statistics on recently triggered rules and corresponding automated actions taken by ThreatStream.
You can click any of the rule categories to view a list of triggered rules in a pop up window. |
All ThreatStream Overview dashboard panels have the management menu allowing you to take the following actions:
-
Open a panel query in Event Search
-
View a full-screen version of a panel
-
Share a panel with other ThreatStream users in your organization.
-
Inspect panel data
-
Refresh panel data
For details, refer to Managing Dashboard Panels or Managing Dashboard Panels (Classic UI) if you use the Classic UI.